
1. Sign in to the home screen and click "USAGE" in the menu on the left-hand side.
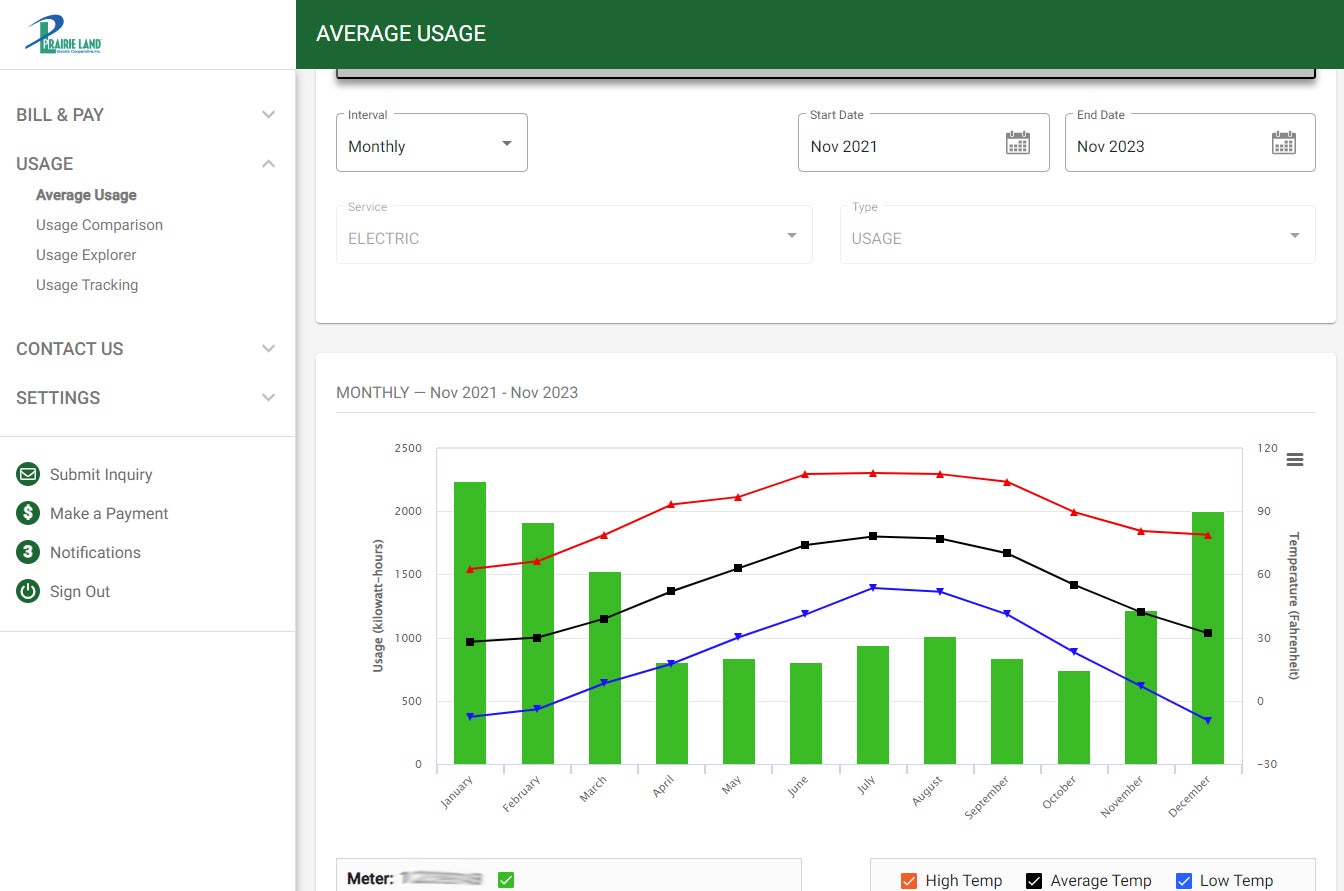
2. Click on "Average Usage."
3. By default it will show usage over the past 2 years. The bars, which may vary in color, show the usage, and the optional red, black and/or blue lines track the temperature for that time period. You can click the buttons to choose how long of a time period you want to view, which dates to pull up or a very specific date range. If you have more than one meter or account, select the one you are looking for information on.
3. By default it will show usage over the past 2 years. The bars, which may vary in color, show the usage, and the optional red, black and/or blue lines track the temperature for that time period. You can click the buttons to choose how long of a time period you want to view, which dates to pull up or a very specific date range. If you have more than one meter or account, select the one you are looking for information on.